


Check back monthly to view updated data
State of the Economy Q1 and Early Q2 2020
In the first quarter of 2020, the global pandemic of the COVID-19 virus (a.k.a. “Coronavirus”) has made its mark across the world, and the United States (US) economy has certainly not been immune to this crisis. Through May 2020, the number of active Coronavirus cases within the US is in excess of 1 million, and the total number of deaths over 100,000. And through April 2020, the unemployment rate was at 14.7%, which was its highest reading since the Great Depression. However, on Friday, June 5th, the US Department of Labor released a report shocking most economists; through the month of May, US employers added 2.5 million jobs, defying the expectations of 7.5 million jobs lost. Many speculate (and hope) that we have crested the ‘peak’ for new cases here in the US, but economists across the globe have and will continue to debate the extent of the economic and financial fallout over the coming months. Whether you are a portfolio manager, policymaker, institutional investor, developer, or just another hard working American wondering if and when your 401k is going to fully recover from the nosedive it took in March, we’re all looking for answers to that paramount question, ‘what comes next for the construction industry?’. As difficult as that question is to answer, let’s take a look at how we can leverage readily available geospatial data to understand how COVID-19 is currently impacting the application for new Building Permits, and potentially, how we might be able to extrapolate that information to project overall market response.
Although a number of key indicators must be analyzed when considering trends, there are three primary leading indicators investors/economists can utilize to analyze market strength of the Construction Industry: Home Sales, Construction Spending, and Home Building (a.k.a. Building Permits). This information is collected by the Department of Commerce (DoC) at various municipal, county, state, and regional levels, and is published by the US Census Bureau every month (or for some data, less frequently). While all three of these are useful in analyzing and forecasting trends in the industry, Building Permits is the ‘earliest’ indicator of the three. Although the data collected by the DoC only incorporates Residential Construction new building permits authorized, it is generally regarded by those who actively analyze the data as a steady barometer for consumer confidence and overall solvency of the market. To conduct this study, Vertex utilized the raw ‘Unadjusted’ data collected by the DoC that was not ‘Seasonally Adjusted’. While most forecasting situations would appropriately incorporate the adjusted figures, which are derived by the US Census program called X-13ARIMA-SEATS, we considered that applying the normal ‘Seasonal Adjustment’ factors could ‘muddy’ user interpretation of how COVID-19 is truly impacting the sector. In addition, ‘Seasonally Adjusted’ figures are not immediately available at the state level to project onto a geospatial map.
Milestones in the Construction Industry During Early 2020
Consider these key milestones: the first Coronavirus related death was reported here in the United States on February 29, 2020. By mid-March, state and local government officials began issuing stay-at-home orders and guidelines, which attempted to define essential and non-essential workers. Much to the frustration of Contractors and Owners alike, these guidelines were often inconclusive, and sometimes downright confusing. On March 31, the US Department of Homeland Security issued formal guidance in an attempt to define ‘essential workers’, and even issued a revision a few weeks later to further clarify and expand the scope specifically for the construction industry; unfortunately, this ‘formal guidance’ still largely left the ambiguity for state and local officials to wrestle with, and for Owners/Contractors to digest, interpret, and act upon (sometimes conflicting) information.
Building Permit Analysis Across the United States
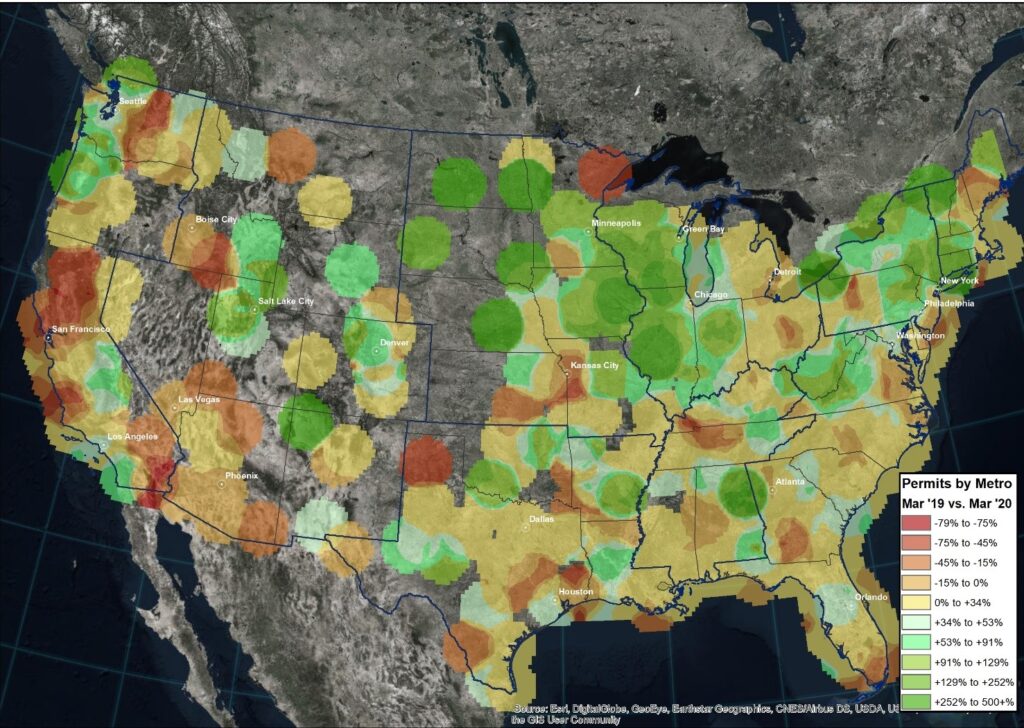
Considering our timeline above, if I were to ask you off the cuff whether you thought overall Building Permits approved in the US ‘increased or decreased’ from February to March 2020, I would imagine you might guess: a slight decrease. Would you be surprised to know that permits actually climbed 15.5% month over month? I certainly was; below is a raster map using an interpolation method called kriging to reflect this at a metropolitan level. Areas without color shading indicate a lack of data provided during the monthly census. Areas of shading indicate %increase with light green indicating increase and oranges indicating decrease.
Let’s look back from 2019. The choropleth map below shows the year over year change from March 2019 to March 2020. Keep in mind that these are seasonally unadjusted numbers, and the shading does not consider any normalization. But more on that in a second – see any oddities?
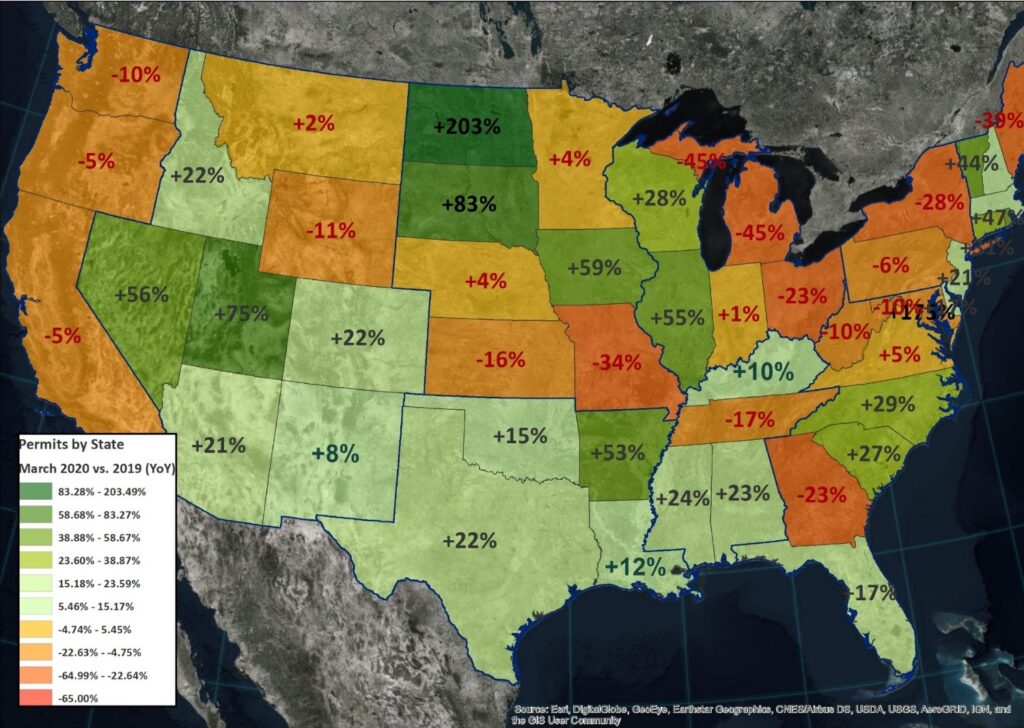
Much of this might not be surprising, depending on where you reside. But regardless… I know what you’re thinking… what are we missing out on up in North Dakota? If we were to have ‘normalized’ this data, you would consider that the Total permits in March of 2019 was 86, which jumped to 261 a year later. This is a drop in the bucket compared to Texas, Florida, and California, which had the highest respective monthly permit counts in March 2020 of 19,293, 13,674, and 7,949 respectively. The moral of this story is to always ensure that you understand the full story from any ‘data’ you review. Aside from that, consider that the year over year delta from 2019 to 2020 in February and March was +11.8% and +9.6% respectively. Using the unadjusted raw units from March 2020 to April 2020, we saw a -17.2% decline month over month, and a -19% decline year over year.
The map below reflects the month over month change from March to April 2020 at the state level and is overlaid with the subset of metropolitan/county areas within.
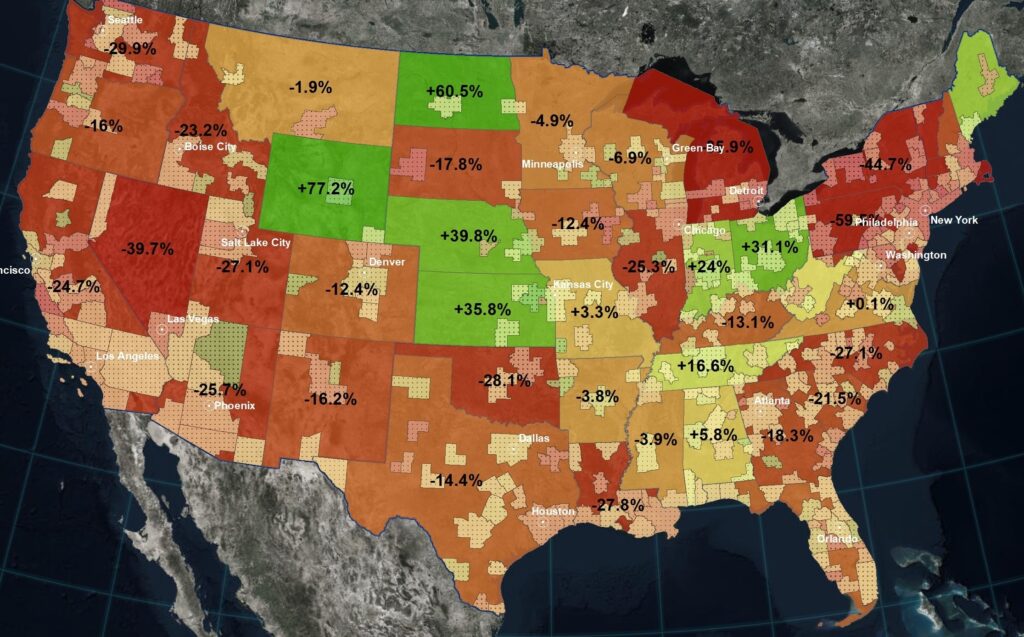
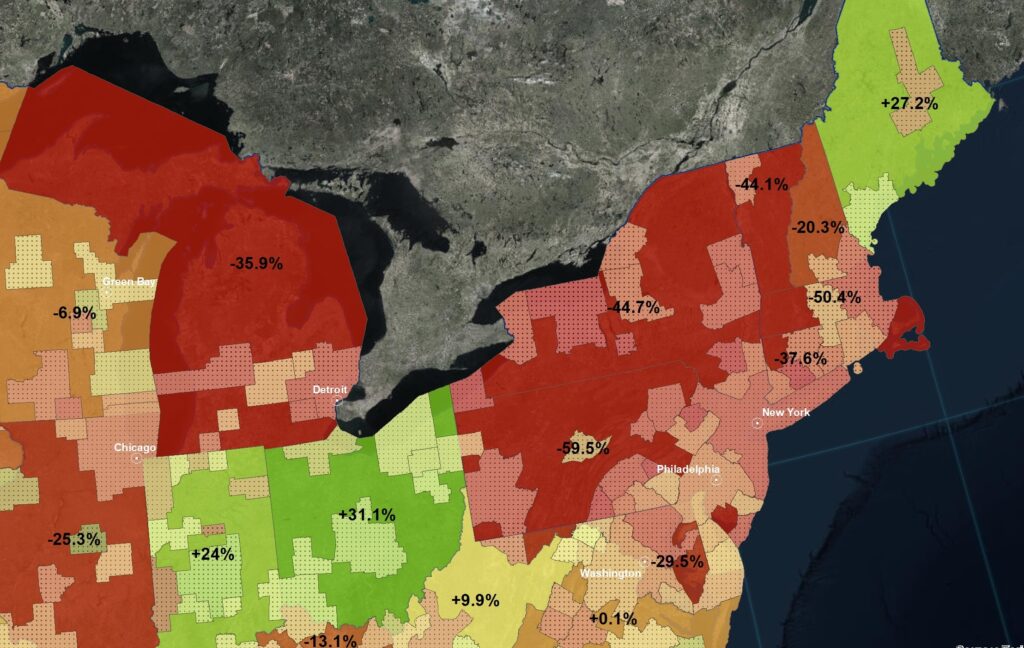
Remember earlier the mention of some ‘ambiguity’ in state/local guidelines? How about in Arizona, where permits dropped -25% overall (total of 3,316 in April), and somehow Flagstaff county exploded by 575% compared to the previous month (total of 223 in April). Albeit this is certainly an outlier, and it is not altogether surprising that many states and cities have opposing figures on a monthly basis, the deviation is significant when you consider the implications of COVID-19. The map speaks for itself, but just a few more notable examples: [Colorado total -12% vs. Denver at +44%], [Dallas at +4% vs. Houston at -36% vs. Texas overall -14%], [Georgia overall -18% vs. Albany at +150%]. Not surprisingly, the map shows us that the states with the sharpest decline are in the northeast, such as New York, Massachusetts, Pennsylvania, New Jersey, Connecticut, as well as Washington and Nevada to the west all had to grapple with the worst of the pandemic.
Predictions for the Construction Industry Based on the Building Permit Analysis
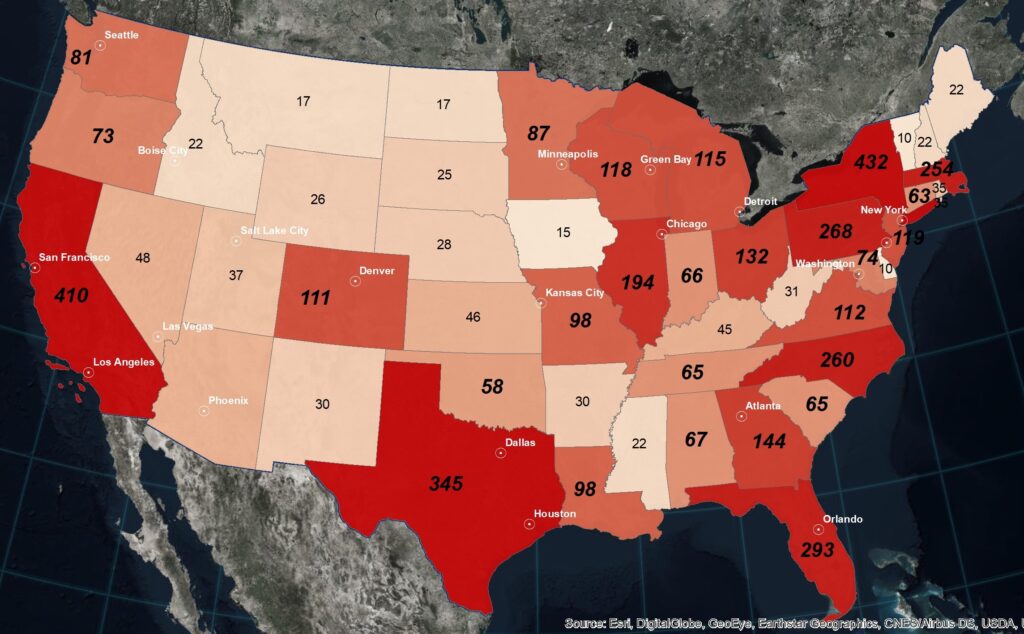
As of May 18th, New Jersey became the last state to begin re-opening certain construction operations within the state. However, even as of June 4th, there are still multiple states that do not have a uniform ‘construction is essential policy’, or only allow phased re-opening of certain areas within the state (such as New York). As projects continue to reel from the Government mandated ‘shut-downs’ due to COVID-19, stakeholders with ongoing projects begin to piece together the ramifications of the delays and how to properly document and manage any associated claims. This is echoed in the map below, which is based on data collected from ConstructConnect.com and their tabular reports showing delayed projects due to COVID-19 by state. In all likelihood, we are likely to see an uptick in the number of COVID-19 related construction project delays in the sectors of the country most affected, particularly in markets where there appears to be large opposing momentums of state and localized permits approved. Realistically, each claim is absolutely tied to unique circumstances involving state/local mandates, specific contractual requirements, and actions taken by the parties to mitigate the impacts; all of these factors must be taken into consideration when forging ahead with a COVID-19 related construction claim, and I cannot stress enough the importance of conferring with an expert consultant.
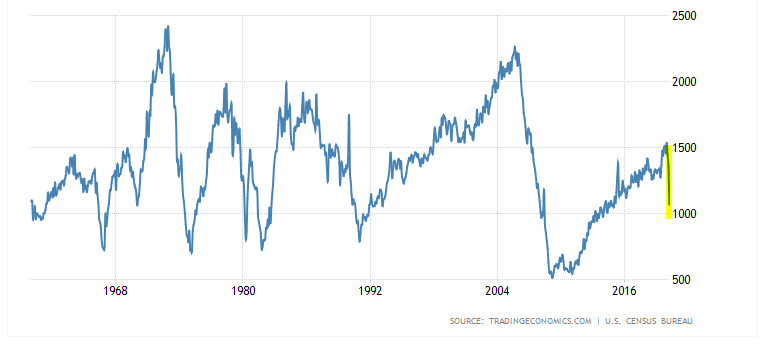
Jumping back to our original question of, “what comes next for the construction industry?”, we need to consider the following: First, we can confirm the somewhat obvious in that there are areas of the country that have seen (and will continue to see) greater impacts from this crisis on the construction marketplace. That being said, there are some isolated pockets around the country that seem to be somewhat ‘insulated’ from their local/state neighbors. When you consider that seven major metropolitan areas either maintained or actually had permits increase from March to April including Nashville, Tampa, Austin, Orlando-Kissimmee, Dallas-Fort Worth, Miami-Ft. Lauderdale, and San Antonio, this is certainly promising that many Developers/Owners are still bullish. When the Coronavirus tide finally recedes, this is likely to create new opportunities across all markets. To further the optimism, below is a chart from tradingeconomics.com showing building permits over time and our sharp decline in April. Keep in mind that this is only a small indicator of the overall health of the market, and particularly the construction industry. And perhaps the old saying from Wall Street finally has some legitimacy instead of settling as a punchline, “this time, maybe it is different”.
Vertex is keenly aware that stakeholders across the AEC industry, including Lenders, Owners, Architects, Engineering Firms, Sureties, Contractors, and Vendors have all been grappling with the COVID-19 pandemic across the United States, and each has their own unique challenges to face. These challenges will likely evolve as we work on re-opening.
If you have questions about the research presented herein, or to learn more about Vertex’s Forensic, Engineering, Construction or Environmental solutions, call 888.298.5162 or submit an inquiry.
Stay safe out there!
Reference
Data Updates – Construction Industry Health Assessment with Building Permit Analysis
Vertex’s Bill McConnell and Jeffrey Katz Discuss COVID-19 Construction Impacts with the Westfield Group

The Author
Max Elliott
Senior Construction Consultant, Construction
Max Elliott is Senior Construction Consultant for Vertex’s Real Estate Construction Management Group (ReCon) in Texas.