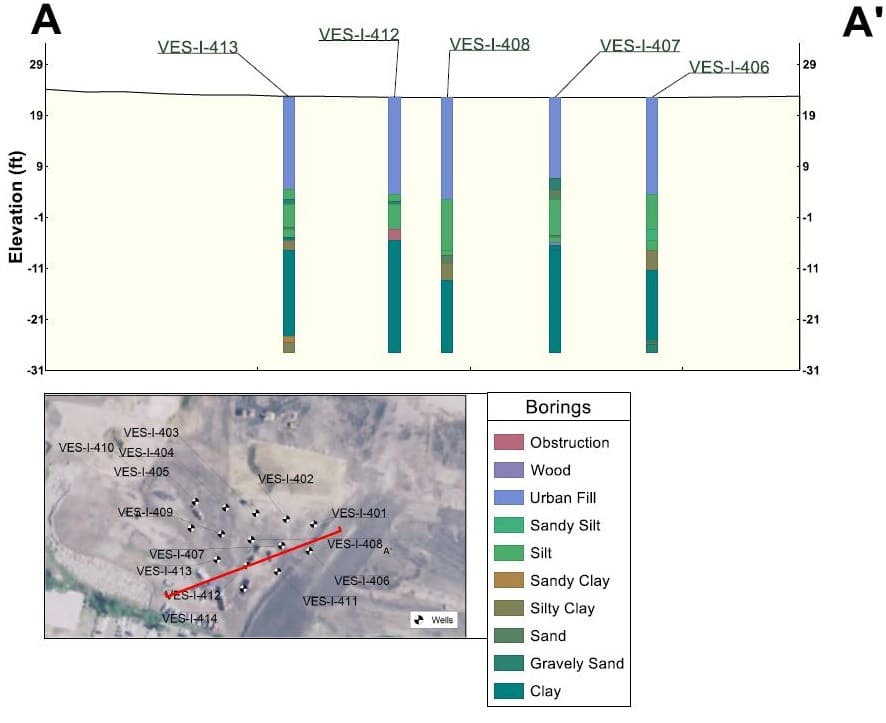
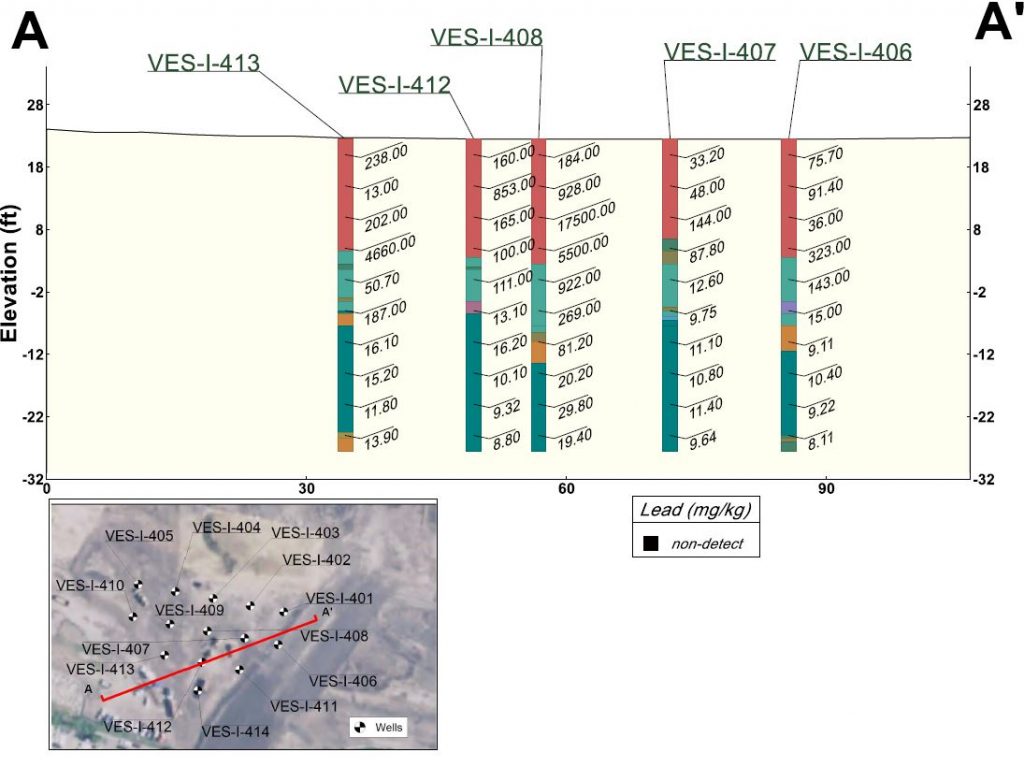
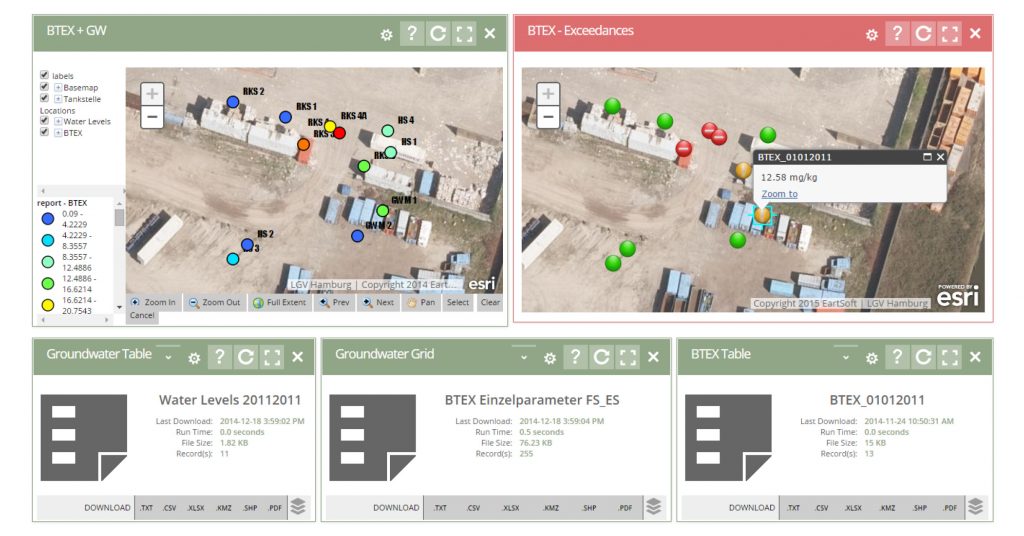
Data – we rely on it every single day to make decisions for our clients. Data insights are influential and persuasive when they are reliable and accessible. We rely on data – on its precision and accuracy – as it drives our regulatory compliance decisions and our evaluation of complex environmental systems.
Environmental Data Management
Many companies struggle with the complexities of collecting and managing environmental data. The data used to characterize environmental issues is coming to us in increasing amounts and in increasingly different formats. These formats include all or some of the following: hard copy reports, electronic databases, spreadsheets, previous investigation tables, and field investigation results. Large sites that are evaluated for potential environmental contamination are often required to collect copious amounts of data. Wells at some locations may be sampled several times per year, and then tested for hundreds of chemicals; soil samples in the form of borings are typically sampled at multiple depths resulting in potentially hundreds of samples, if not more. Paired with additional site activities and monitoring requirements, such as dust emissions collection and both on-site and off-site earth-moving activities, this makes for an enormous amount of data arriving at many different levels in many different formats.

Data Harmonization
As you accumulate data, you must manage that data. Data management is about bringing these varied sources and results from multiple matrices (groundwater, soil, soil gas, air, etc.) together in a cohesive fashion. This process of taking data from fragmented sources and massaging them into a cohesive dataset is called data harmonization. Without harmonization, different data types and formats would be sitting side by side, and it’s very difficult to draw cohesive insights from disparate and fragmented datasets.

Environmental Management Information Systems (EMIS)
Companies use a variety of resources to accomplish this task – to harmonize and manage their data – and at times distinct solutions to analyze the harmonized data. These often include the use of spreadsheets and home-grown databases. But with the copious amounts of data that the industry produces spreadsheets and home-grown databases are typically not quite up to the task. One solution is to implement an Environmental Management Information System (EMIS). An EMIS is defined as ‘organizational-technical systems for systematically obtaining, processing, and making available relevant environmental information available in companies’. An EMIS system can be comprised of a single software package, or several software packages used together to create a system.

Benefits of an EMIS
Of course, data unto itself is not enough. The EMIS system must help you by streamlining your workflow, from pre-planning through collection, and then assist you to analyze, evaluate, visualize, and report the data. It must also assist you in the harmonization of your data, examples of which include standardizing data to user-specified units; allowing sitewide comparisons of user-specified criteria (auto-corrected to the specified units), and automated comparison to regulatory criteria that flags exceedances.
In addition, these powerful tools must also help us turn the aggregation and harmonization of data into data insights. VERTEX leverages these tools to their full potential, enabling faster drive to insights through automating portions of the data-crunching and statistical analysis. These insights are used during analysis and to make our regulatory compliance decisions, they drive our evaluation of complex environmental systems and help us focus our success-driven solutions. Visualization tools also assist us in telling the data’s story to our clients and regulatory agencies by layering data in an easy to understand picture.
How Can VERTEX Help?
After careful consideration, VERTEX has chosen EQuIS as our data management platform. EQuIS is a market leader in environmental data management and has become a standard in the industry. Combining the power of EQuIS and its web portal, Enterprise, along with EQuIS’s many partners, has created an EMIS system that is beneficial to our clients. VERTEX’s use of EQuIS helps us tell the data’s story in an effective way for our clients and regulatory agencies.
To learn more about VERTEX’s Environmental Consulting services or to speak with an Environmental Expert, call 888.298.5162 or submit an inquiry.
Author: Amy Sulborski, ENVIRONMENTAL DATA MANAGER


