


Environmental Sampling & Analysis
Sampling and analysis are an integral part of Phase II Environmental Site Assessments, remediation and ongoing monitoring on contaminated sites.
Following environmental sampling, media such as soil and groundwater samples are analyzed by an environmental analytical laboratory for contaminants of concern specific to the site. These may include metals, petroleum hydrocarbons (PHCs), volatile organic compounds (VOCs), polycyclic aromatic hydrocarbons (PAHs) and polychlorinated biphenyls (PCBs).
Laboratory Data Correlation
In most cases, the laboratory results can be correlated with the issues of potential environmental concern identified, historical data or field observations relating to the site. However, there are occasions when the results reported by the laboratory are unexpected and cannot be readily rationalized. In such cases, it is prudent to discuss the results with the laboratory and where necessary, request for a repeat analysis or decide if re-sampling is warranted.
When to Re-Analyze
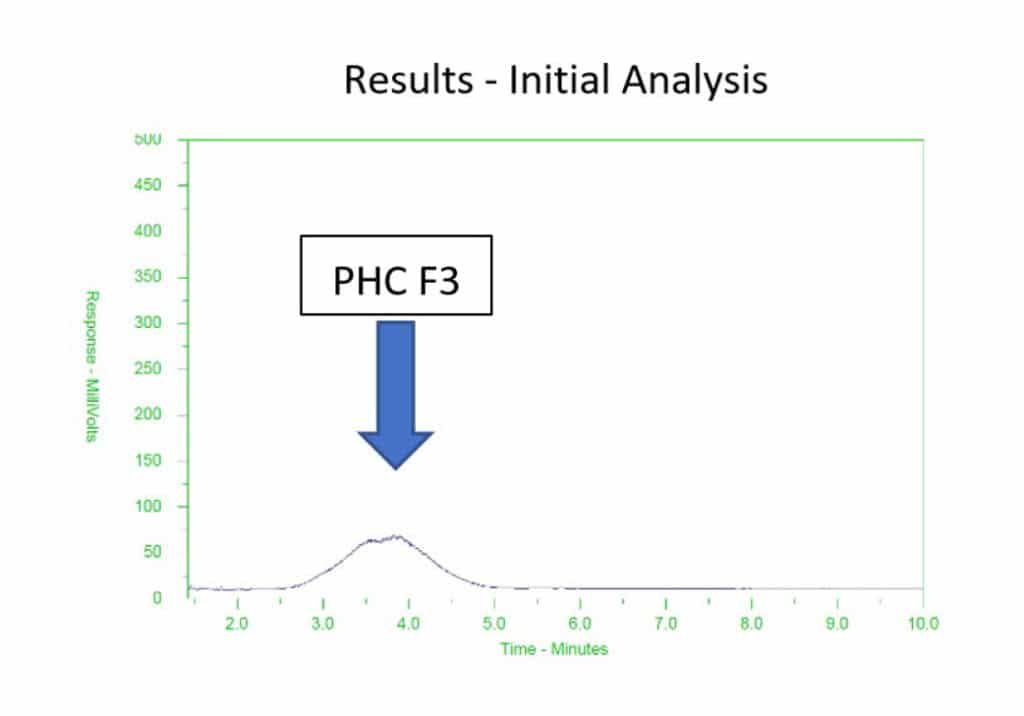
Occasionally, the sample may need to be re-analyzed as was the case in this example. VTX encountered a site that was impacted by petroleum hydrocarbons – predominantly benzene, toluene, ethylbenzene, xylene (BTEX) and PHC F1 fraction. Following remediation, ongoing monitoring of the groundwater was required to be carried out at quarterly intervals to demonstrate the decreasing trends in PHC concentrations. After three successive sampling events over which the expected progressive decreasing trend in concentrations was observed, the fourth sampling event indicated elevated concentrations of the PHC F3 fraction. These results were unexpected as PHC F3 was not identified in any of the previous sampling events.
VTX requested that the laboratory re-analyze the sample. The results of re-analysis indicated that the PHC F3 fraction was in fact below laboratory detection limits and as such, the earlier result reported was an anomaly. As shown in the figures below, the peak at PHC F3 observed in the chromatogram of the initial analysis is not seen in the chromatogram of the re-analysis.
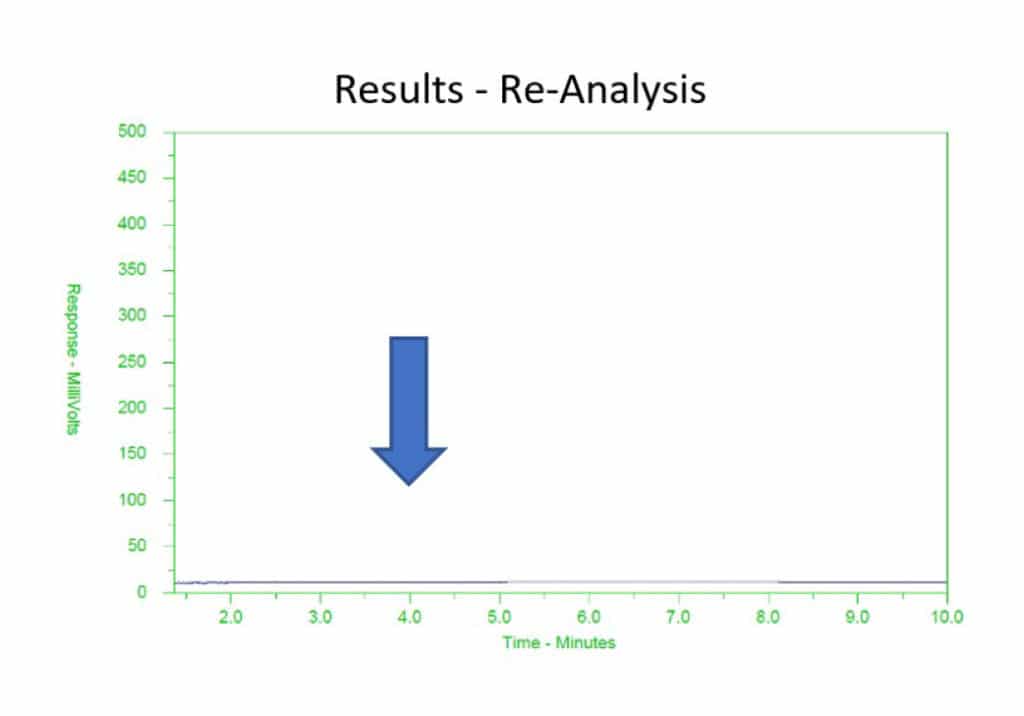
In this case, the efforts involved in correlating the laboratory data with historical, background and field observations and the results of the re-analysis eliminated significant potential regulatory, financial and liability implications for the client.
To learn more about VTX’s Environmental Consulting services, please contact one of our Environmental Experts.
- Jaegar Perna B.A., EPt, Environmental Scientist
- Christopher Farias Ph.D., MRACI C Chem., Principal Environmental Scientist, Environmental Division Manager
Author: Jaegar Perna