


Construction project delays can be costly for all stakeholders. Common causes of delay include weather, labor shortages, material availability, design errors and omissions and changes to the scope of work. Early identification of warning signs can help avoid unexpected costs and delays.
Project schedules can be useful in identifying warning signs prior to a delay to a project milestone or completion. Recognizing warning signs in the schedule early is important to reducing risk and minimizing delay.
In this post, two methods for identifying warning signs in project schedules are discussed:
- Schedule Quality Assessment: Does the schedule reflect the full scope of work and function properly?
- Schedule Risk Analysis: How likely is the project to finish on time?
Understanding schedule quality and schedule risk can help stakeholders manage the work, identify potential delays and set the project up for success.
In addition to the general recommendations below, contracts between project participants may provide requirements regarding the frequency of schedule updates, limitations on the use of constraints, maximum activity duration, etc. Contract schedule requirements can affect the quality assessment of a particular project schedule.
Schedule Quality Assessment
A poor constructed schedule can make it difficult for parties to identify warning signs in a timely manner and manage changes that could prevent or reduce the impact of a delay. Schedule quality assessments are used to evaluate a schedule’s functional utility.
Industry resources are useful in understanding how to build a quality schedule. For example, the Association for the Advancement of Cost Engineering’s (“AACE”) recommended practice 78R-13 Original Baseline Schedule Review – As Applied in Engineering, Procurement, and Construction, discusses the importance of ensuring that a schedule is complete and has a delineation of responsibility for activities. AACE states “[e]ach activity in the schedule should have a primary agent or a single entity in control of the work and responsible for its completion.”[1] AACE also asserts, “all contractual deliverables and significant pieces of work to be performed by the contractor and its subcontractors should be included in the schedule.”
In 2005, the Defense Contract Marketing Agency (DCMA) created a 14-Point Assessment for evaluating schedule quality.[2] Initially, the 14-Point Assessment was used only by the Department of Defense but is now commonly used in the construction industry. The 14 “points” provide benchmarks for various schedule quality metrics and are summarized below.
- Logic
- Are the activities connected with sufficient logic?
- Ideally, every activity should have one predecessor and one successor except for first and last activities.
- The number of activities without a predecessor and/or successors should not exceed 5% of all activities.
- Leads
- Leads refer to negative lag in predecessor relationships. There should be no relationship between activities with leads in a schedule. Consider adding additional activities to capture the sequence detail.
- Lags
- Lags refer to the amount of delay between two activities that are linked by a relationship. If the relationship between two activities is start-to-start or finish-to-finish with lag, it may result in planned overlap between the two activities.
- Lags should occur in no more than 5% of relationships between activities.
- Ideally, lags should be replaced with activities that represent the purpose of the lag, such as cure time.
- Relationship Types
- There are four types of relationship types: Finish-to-Start, Start-to-Finish, Start-to-Start, and Finish-to-Finish.
- Finish-to-Start should represent 90% or more of activity relationships in a schedule per the 14-Point Assessment guidelines.
- Ideally, Start-to-Finish relationships are not used in a schedule.
- Hard Constraints
- Activities with hard constraints are those not logically driven, but rather are driven by one of the following: Must-Finish-On, Must-Start-On, Start-No-Later-Than and Finish-No-Later-Than.
- Hard constraints should be utilized in 5% or less of uncompleted tasks.
- High Float
- This metric includes activities that have a float greater than 44 days or 2 months.
- High float values should occur in no more than 5% of uncompleted activities.
- Negative Float
- Negative float refers to incomplete activities with float less than 0 working days.
- Activities should not have negative float, but if necessary, the scheduler should provide an explanation as well as a plan to mitigate it.
- High Duration Activities
- This metric includes activities that are longer than 44 working days or 2 months.
- These high duration tasks should be broken down into two or more tasks.
- Limit long duration activities to 5% of incomplete activities.
- Invalid Dates
- This metric refers to activities that are actualized but have dates that are after the schedule status date (i.e., actualized dates in the future) or activities that have forecasted dates prior to the schedule status date.
- Invalid dates should not exist in a schedule.
- Resources
- This metric measures the number of activities without either dollars or hours assigned when the schedule utilizes resource loading.
- Missed Tasks
- This metric tracks activities planned for completion prior to the status date or if the forecasted finish date is after the baseline completion date.
- Ideally, 5% or less of activities should be considered “missed.”
- Critical Path Test
- This test checks to see if the schedule has one continuous linkage from start to finish to determine the integrity of a schedule’s critical path.
- Critical Path Length Index (CPLI)
- This metric assess the level of efficiency required to complete the project on schedule using the ratio of the project critical path length and the total float to the project critical path length.
- Critical path length is the time in workdays from the current date to the completion of the project.
- A CPLI value of 1.0 means that the project must accomplish one day’s worth of work each day in order to meet the baseline milestones.
- If the CPLI is less than 0.95, the schedule requires a further review.
- Baseline Execution Index (BEI)
- This metric calculates the efficiency with which tasks have been completed compared to the should-have-been progress in the baseline schedule.
- This can serve as an early warning indicator that a schedule is in trouble of not meeting the deadline.
- A BEI value of 1.0 means that the project has completed the planned amount of activities based on the activities’ dates in the baseline schedule.
- If the BEI is less than 0.95, the schedule requires a further review.
Additional schedule metrics that may be warning signs of project delay include:
- High number of critical and/or near-critical activities
- Aggressive durations or production rates
- Aggressive Forecasted Compression or Parallel Work
For example, a high number of critical and near-critical path activities means that there are a high number of activities with potential to delay the project completion date.
Schedule quality may also be impacted if work that has been added, changed or re-sequenced is not appropriately reflected in schedule updates. Added, changed or re-sequenced work may require
- additional activities
- modifications to existing activities
- adding or modifying schedule logic
- added activity codes or activity descriptions denoting what was added (e.g. including CO number coding if it is related to an approved changed)
- Time Impact Analyses or forensics analyses to determine the impact of these changes on the critical path
Contracts often require contractors to update the project schedule periodically to show progress as well as changed or affected work. According to AACE’s Recommended Practice 53R-06 Schedule Update Review – As Applied in Engineering, Procurement, and Construction, schedule updates “should be made on the next periodic schedule update cycle date. . .as determined by contractual frequency requirements.”[3] Keeping project schedules updated can help ensure schedule quality and potentially reduce the risk of delays.
Schedule Risk Analysis
A Schedule Risk Analysis evaluates the likelihood of a schedule finishing on time. The most common type of schedule risk analysis is the Monte Carlo Simulation, which allows the scheduler to simulate possible outcomes on a project.
Using software such as Acumen Fuse or Primavera Risk Assessment, the scheduler inputs variables for likely durations and/or costs, and the Monte Carlo Simulation outputs a distribution graph of how likely a schedule is to finish by a given date.
Below is an example of a Monte Carlo Distribution Chart:
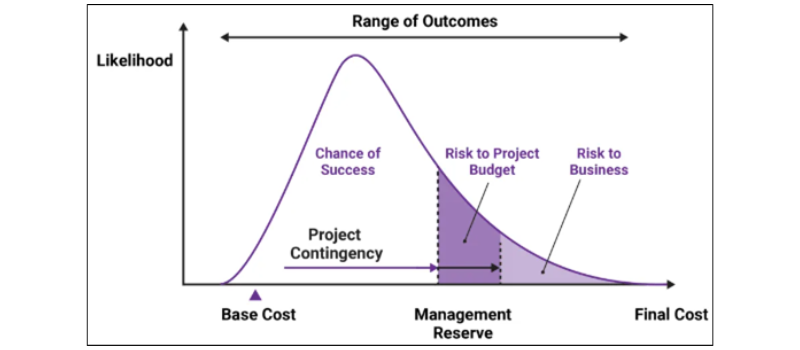
Source: projectmanagementacademy.net
The Monte Carlo Simulation provides more accurate forecasting by using a probabilistic approach that allows for a comprehensive view of the project performance. The benefits of Schedule Risk Analysis include enhanced decision-making and improved risk management by allowing stakeholders to identify high-risk areas to help make informed decisions.
If you have questions about this brief discussion on using project schedules to identify warning signs of possible project delays and to learn more about VERTEX’s Construction Claims Consulting services, please contact Madison Maune (mmaune@vertexeng.com) or submit an inquiry to VERTEX directly.
References:
1.AACE Recommended Practice 78R-13 Original Baseline Schedule Review – As Applied in Engineering, Procurement, and Construction, Rev. October 23, 2014, p. 3.
2. Earned Value Management System (EVMS) Program Analysis Pamphlet (PAP) dated October 29, 2012.
3. AACE Recommended Practice 53R-06 Schedule Update Review – As Applied in Engineering, Procurement, and Construction, Rev. August 14, 2008, p. 8.

The Author
Madison Maune
CST, CCT
Associate, Contract Claims
Madison assists in the investigation and resolution of complex business and construction disputes. She has experience in the analysis of cost and schedule delay issues on construction projects. Madison has assisted in the development of expert reports and supporting analyses.